DevConsole
A built-in web dashboard for development-time monitoring and debugging. It is automatically enabled when APP_ENV=development; other environments require DEVCONSOLE_ENABLED=true. It is accessible at http://localhost:{PORT}/_devconsole/.
DevConsole is zero-config, localhost-only, and requires no additional setup beyond running your app in development mode.
Screenshots
Dashboard
Routes
OpenAPI Schema
HTTP Requests
SRPC
Database Entities
Database Log
Health Checks
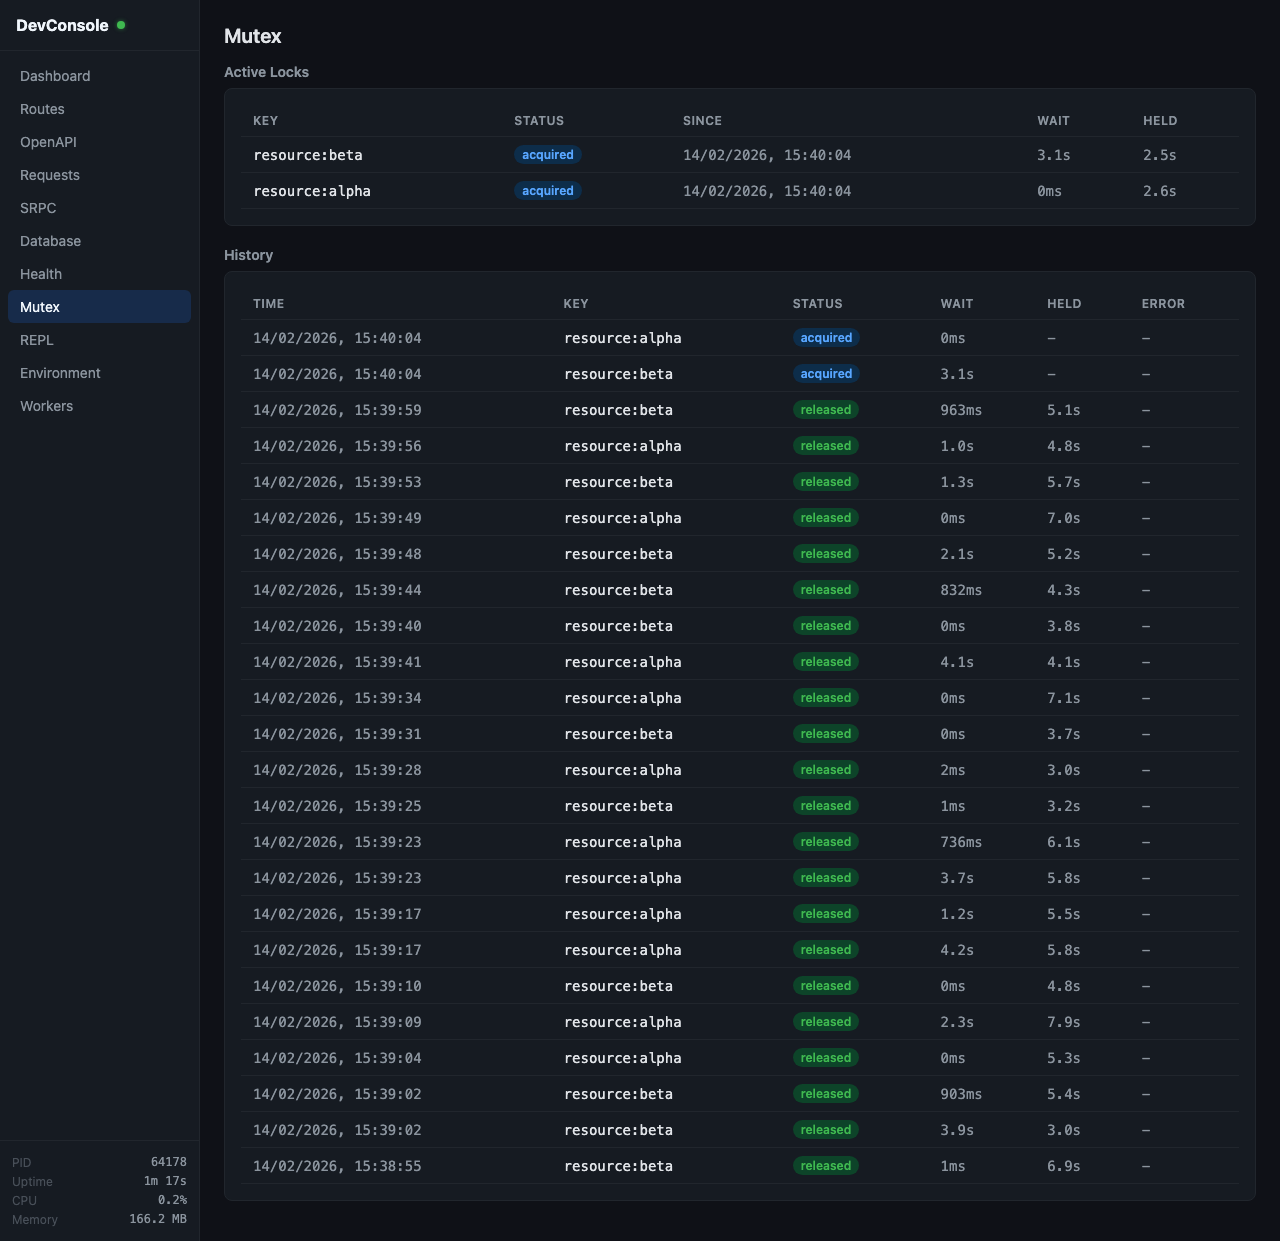
Mutex Monitor
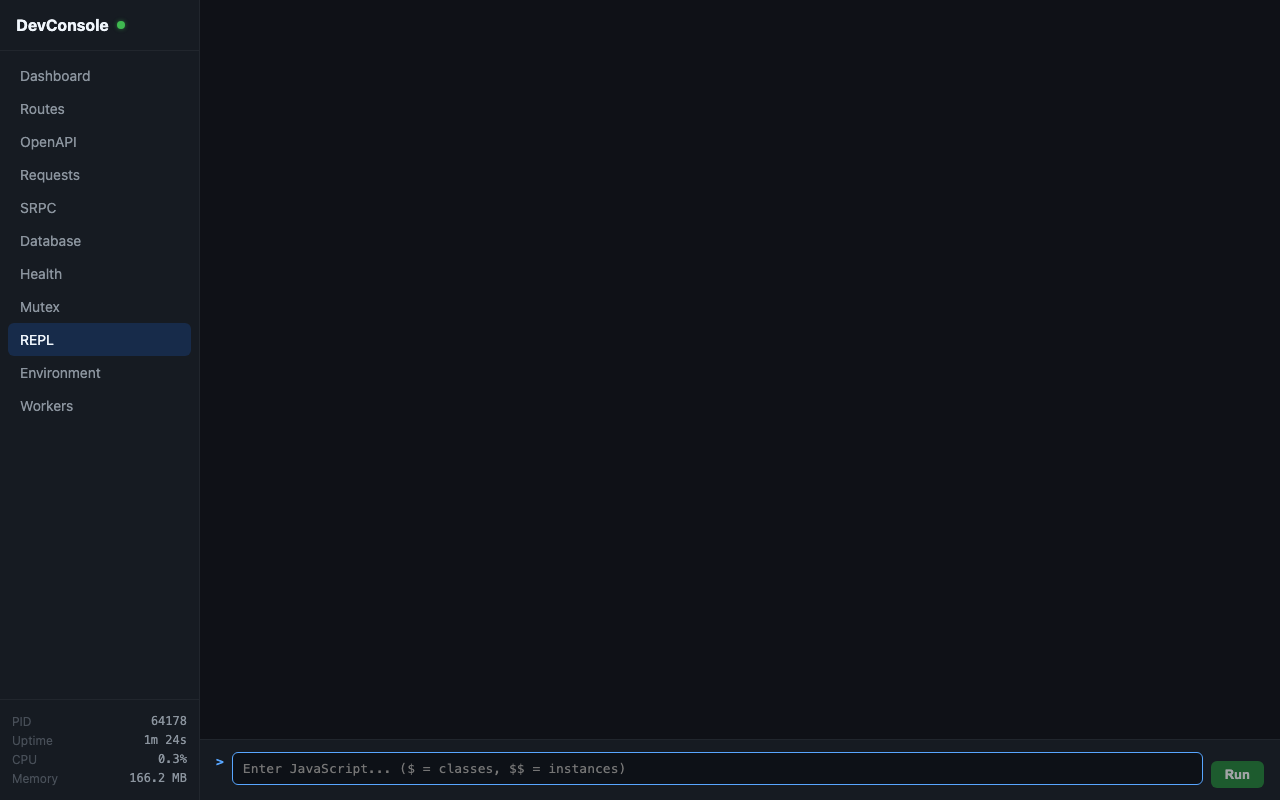
Interactive REPL
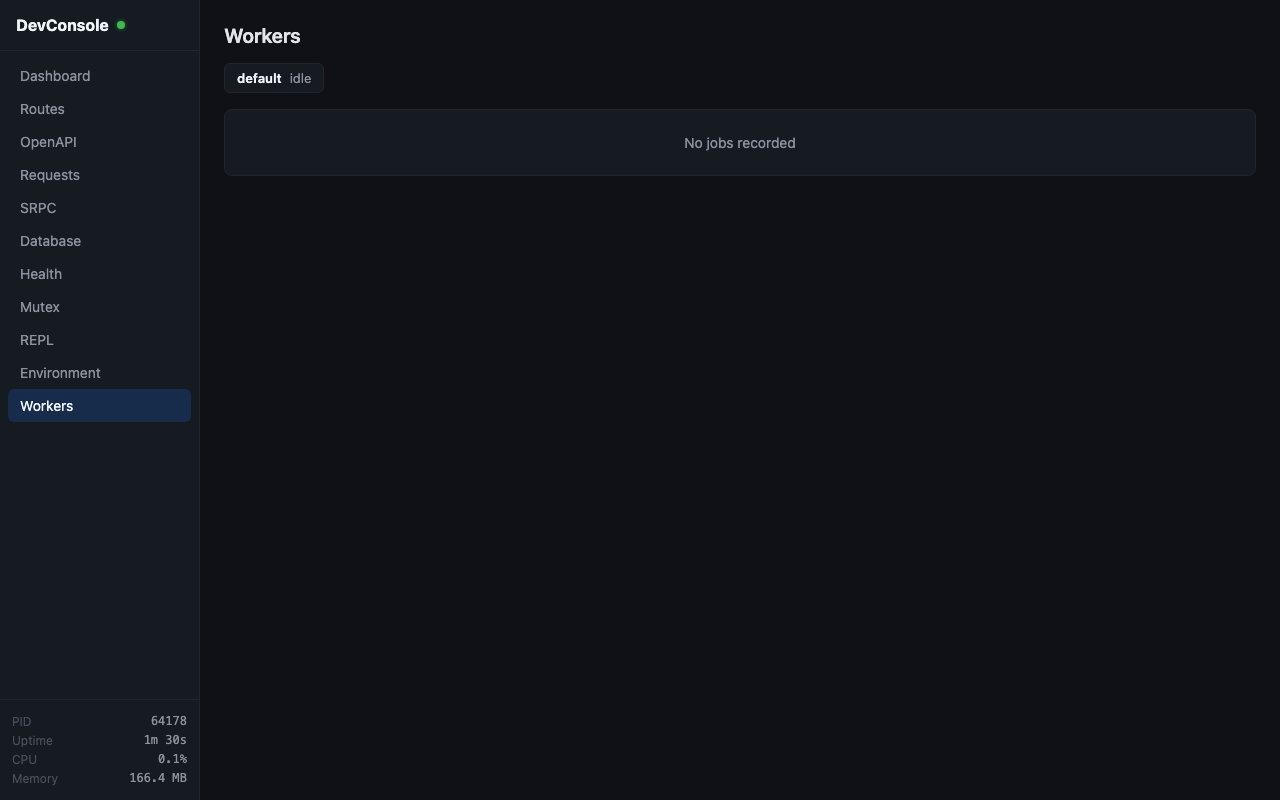
Workers
Views
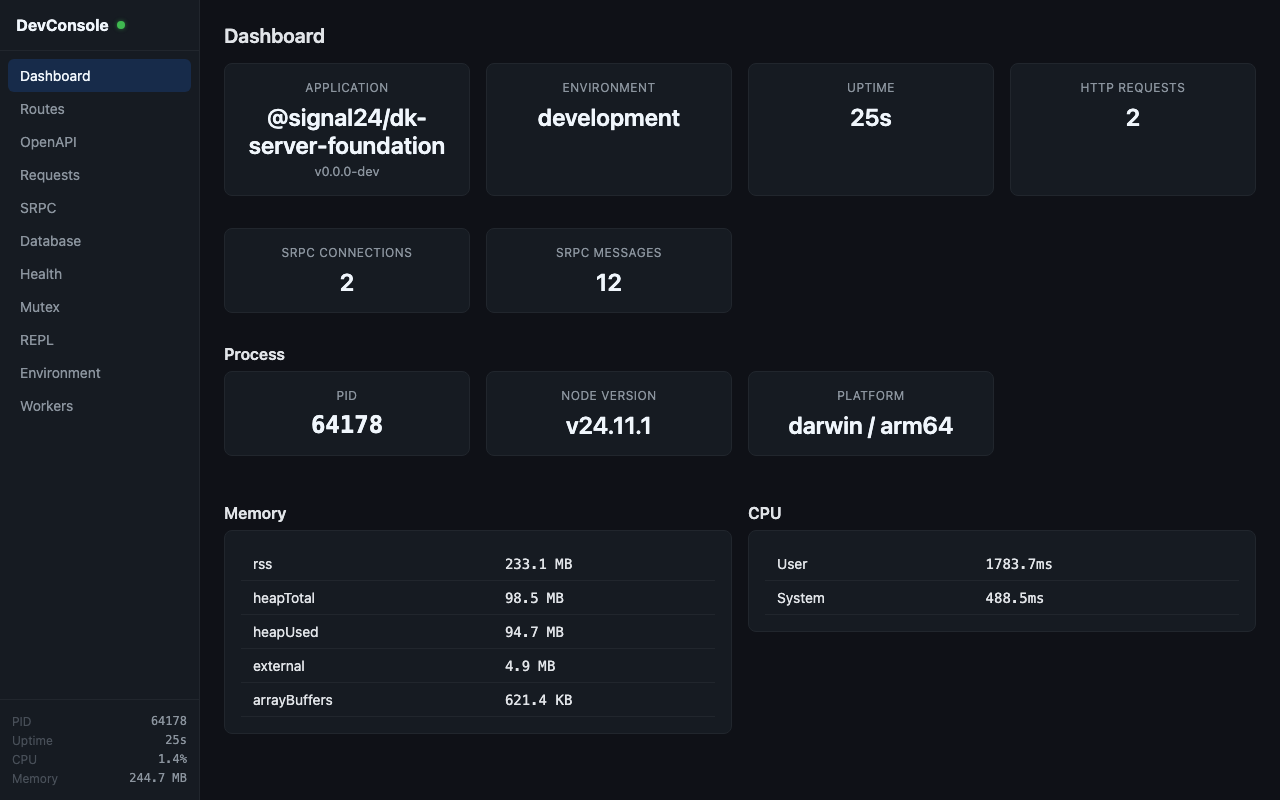
Dashboard
App overview showing name, version, environment, uptime, and real-time statistics (HTTP request count, SRPC connections/messages). Also displays process info: PID, Node version, platform, CPU usage, and memory consumption.
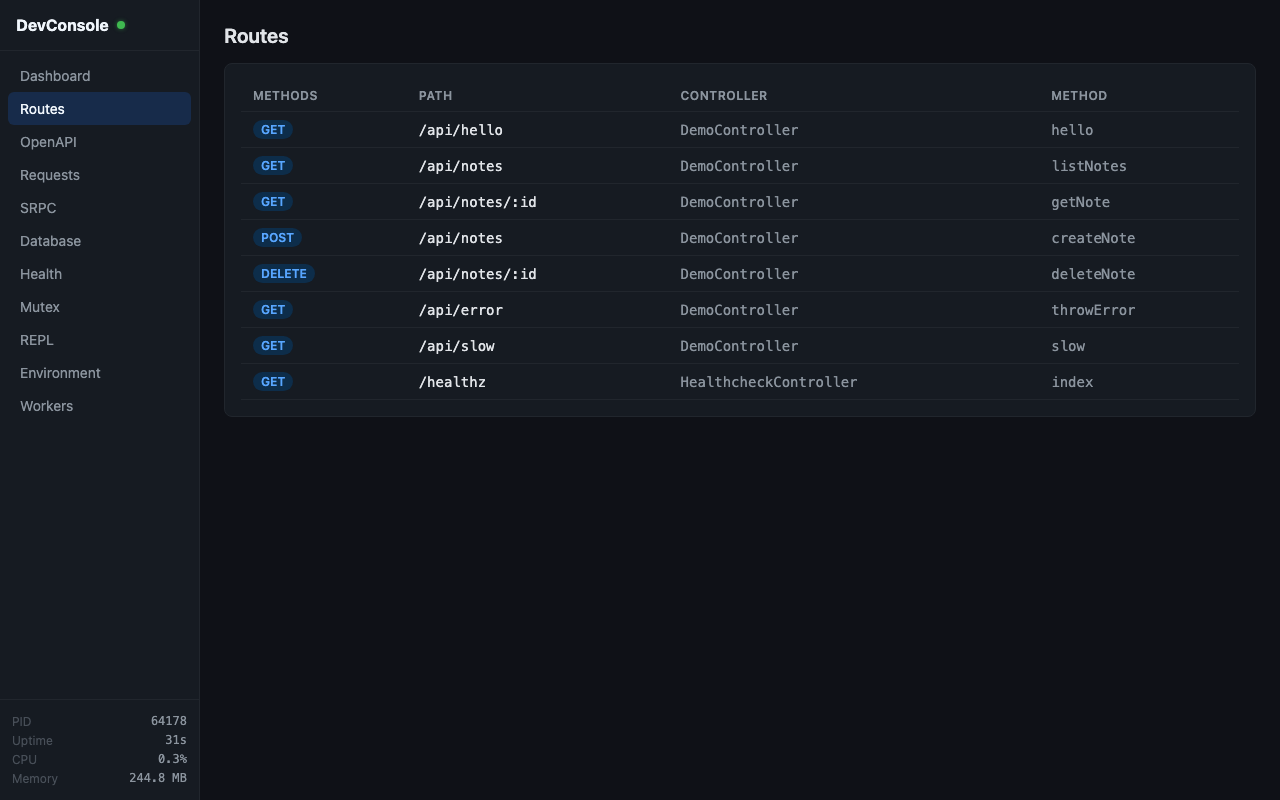
Routes
Lists all registered HTTP routes with their methods, paths, controller class, and handler method. Internal /_devconsole routes are excluded.
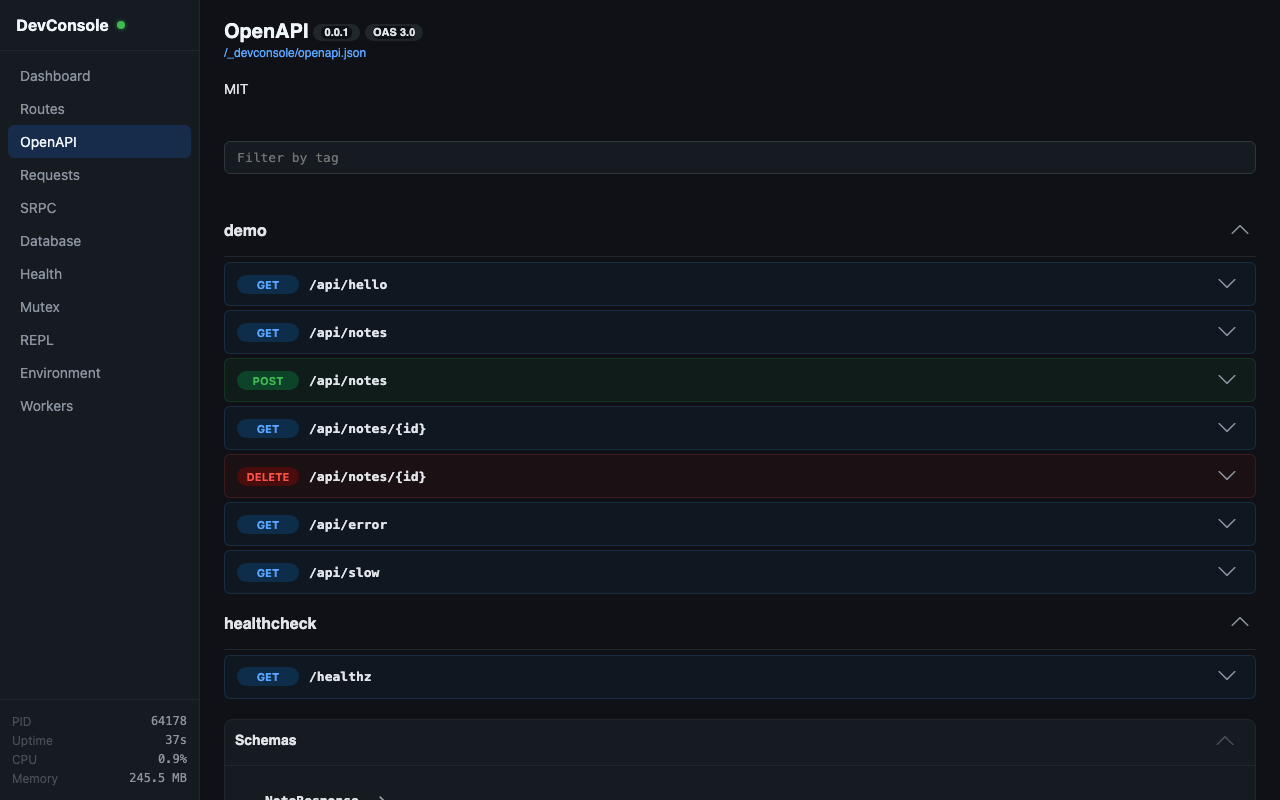
OpenAPI
Displays the OpenAPI schema generated from your HTTP routes. The schema is loaded from the app-level /openapi.json endpoint.
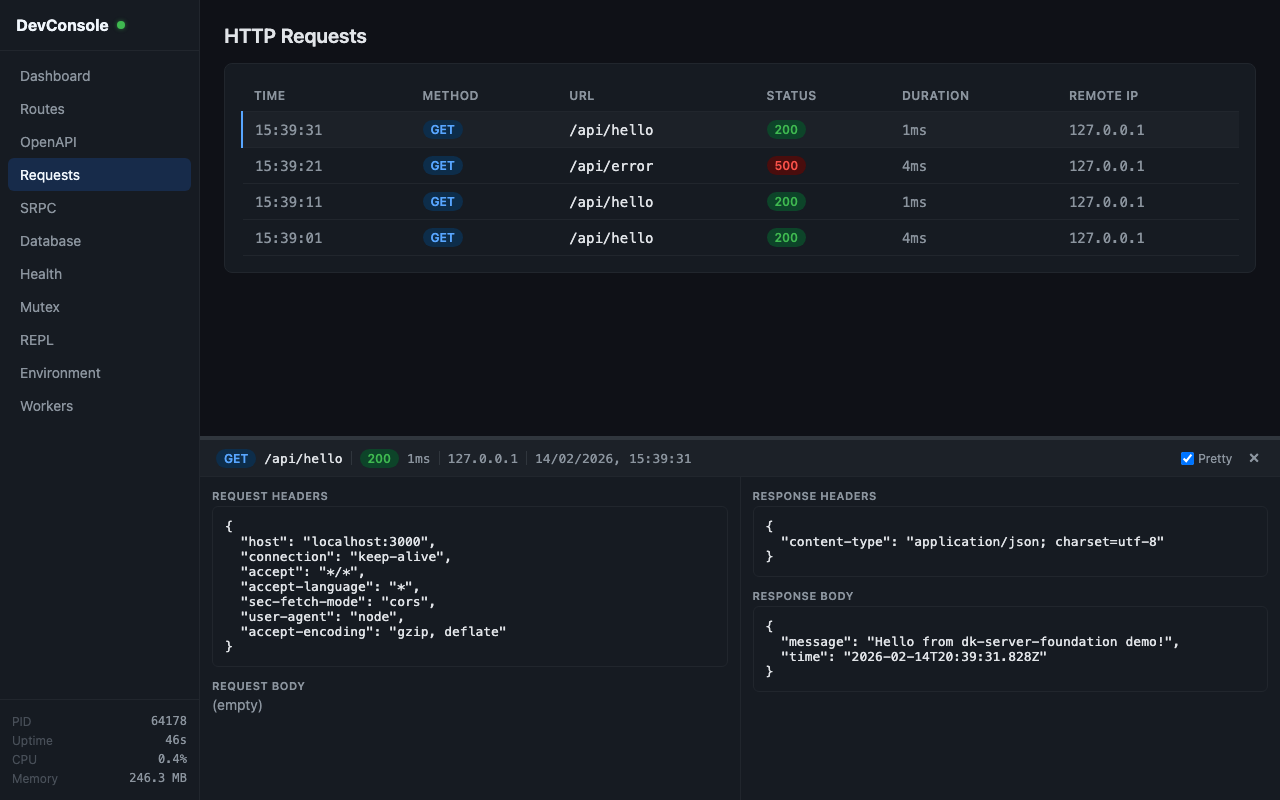
Requests
HTTP request inspector capturing the last 500 requests. Shows timestamp, method, URL, status code, duration, and remote address. Expanding a request reveals full request/response headers and body previews (up to 64 KiB), plus error details with stack traces for failed requests. New requests appear in real time.
A search input filters the table by URL substring (case-insensitive). The Clear button removes all captured entries — this is synced across connected DevConsole clients via a server broadcast.
SRPC
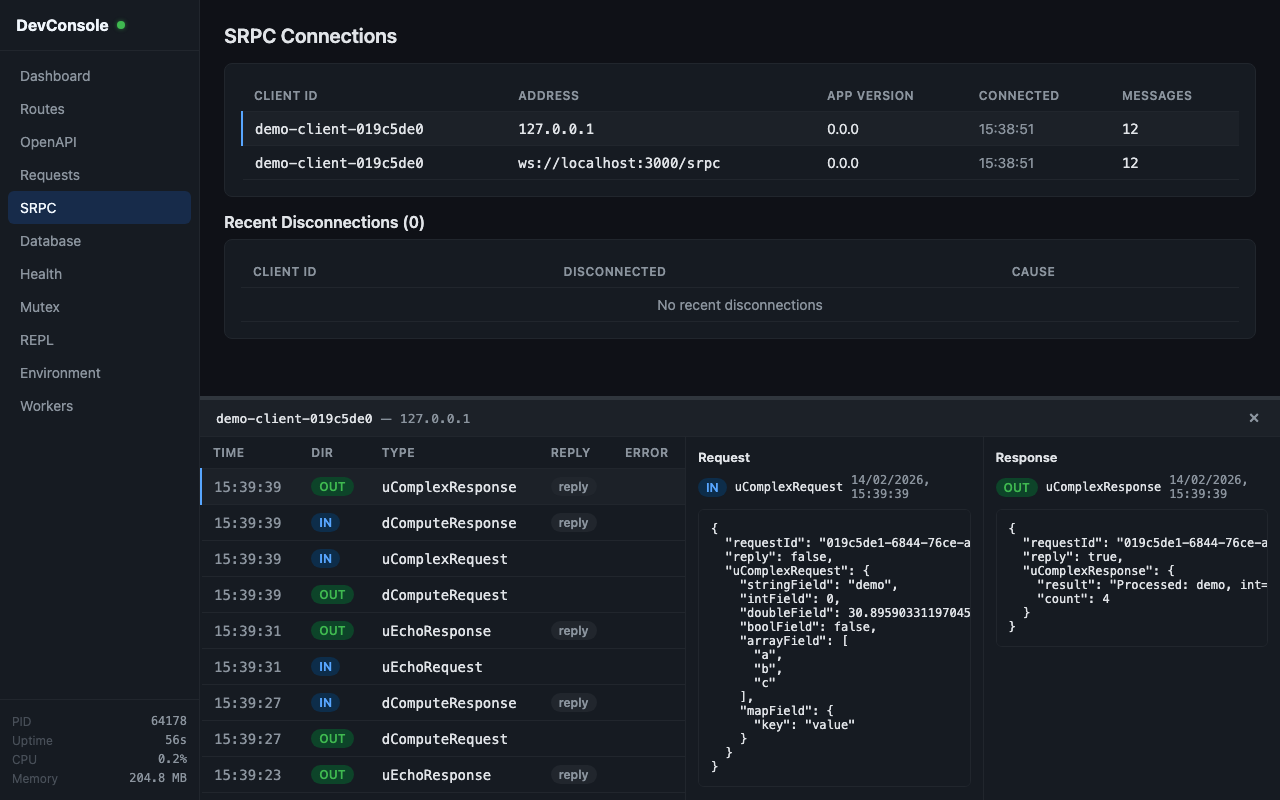
SRPC connection monitor showing active connections (client ID, stream ID, app version, address, uptime, ping, message count) and recent disconnections. Includes a message-level inspector (last 500 messages) showing type, direction, request ID, reply status, and errors. Messages can be filtered by stream ID.
A search input filters the per-connection message list by message type (case-insensitive). The Clear button removes all captured messages and recent disconnections — synced across clients.
Database Entities
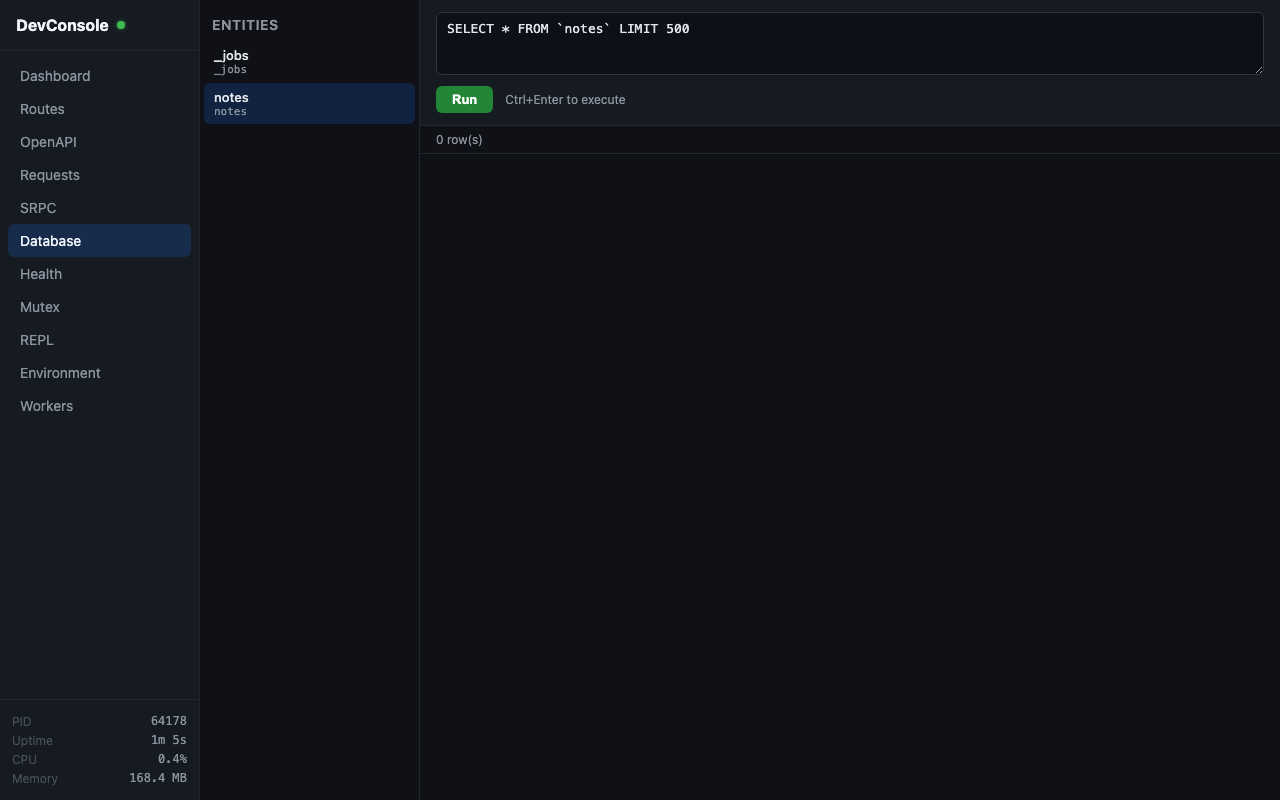
Entity browser listing all registered ORM entities with table names and columns. Includes a SQL query editor — SELECT queries return result rows, while INSERT/UPDATE/DELETE return affected row counts. Execute with Ctrl+Enter.
Database Log
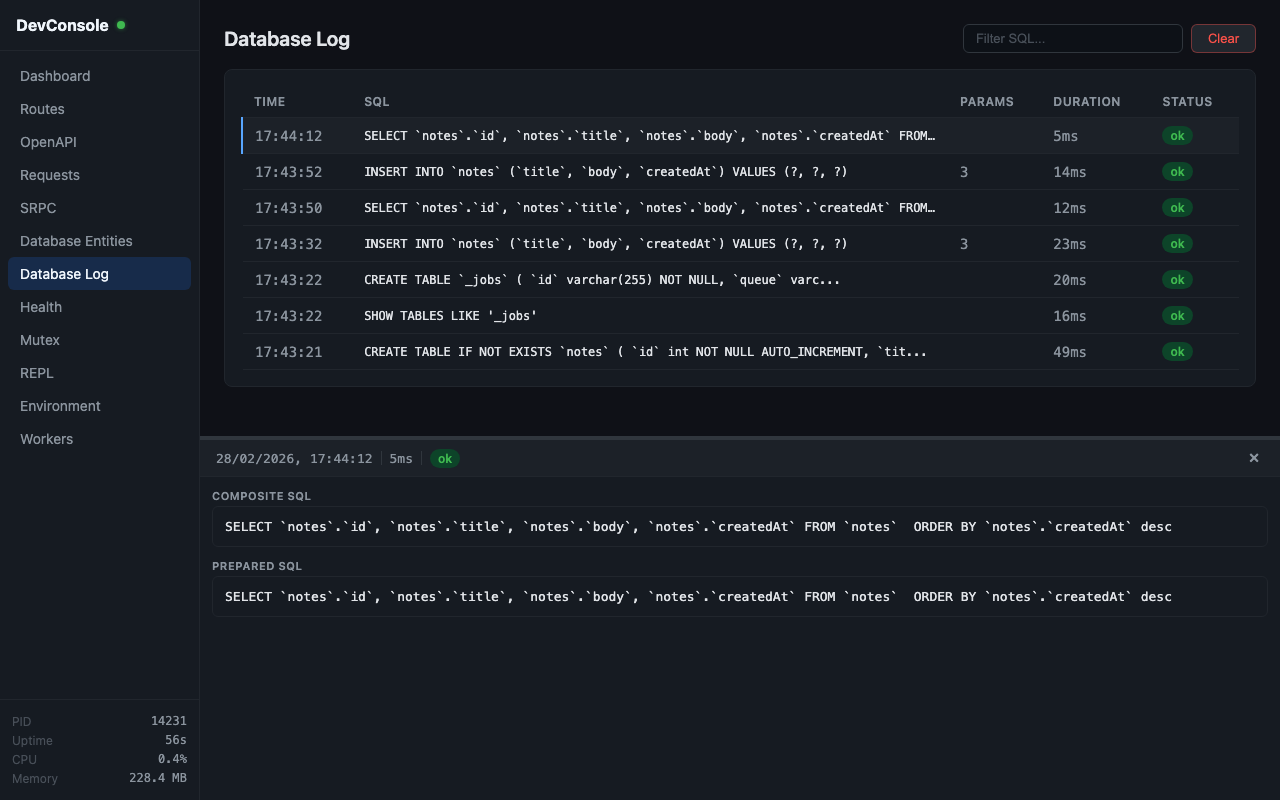
Live query log capturing SQL emitted through TSF's process-global database observer. Queries appear immediately with a running status and update on completion with duration and error info (last 500 entries). In a process containing multiple apps, the log can include queries from their database layers as described under How It Works.
The table shows timestamp, SQL (truncated), parameter count, duration, and status. Clicking a row opens a detail panel with:
- Composite SQL — the prepared SQL with binding placeholders replaced by their values inline, formatted for readability (dates as
'YYYY-MM-DD HH:mm:ss'in UTC, strings escaped, numbers bare, booleans asTRUE/FALSE, JSON objects as quoted strings, nulls asNULL) - Prepared SQL — the raw parameterized SQL
- Bindings — the parameter values as JSON
- Error — error message (if the query failed)
A search input filters by SQL substring. The Clear button removes all captured queries — synced across clients.
Query capture uses registerDatabaseQueryObserver(), which receives start and finish events from BaseDatabase.rawFind(), BaseDatabase.rawExecute(), sessions, and query builders.
Health
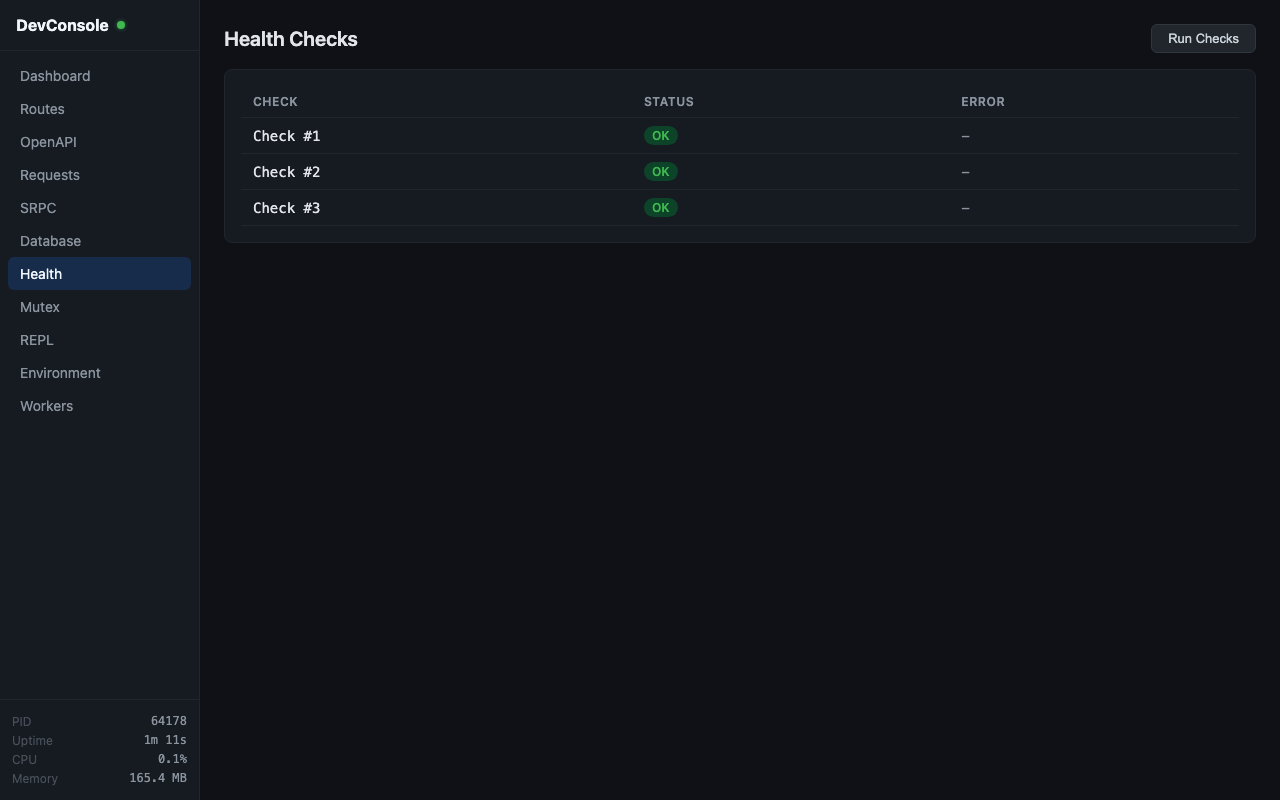
Displays results from all registered health checks with status (ok/error) and error messages.
Mutex
Redis mutex monitor showing active mutexes (key, status, timing) and a history of the last 200 completed/failed acquisitions with wait and hold duration metrics.
REPL
Interactive JavaScript REPL running in the server's context. Resolve an explicit DI token with resolve(token) or r(token). $ is a name-indexed namespace of singleton and transient provider tokens ($.UserService), while $$ lazily resolves matching provider instances from their owning module ($$.UserService) and exposes registered entity classes ($$.User). Transient providers create a new value per access; request- and HTTP-scoped providers, including controllers, are excluded because the REPL has no request context. Supports Tab-completion, command history (arrow keys), and multiline input (Shift+Enter). Console output (log, warn, error) is captured and displayed.
The context also exposes app, container, config, an optional db, process, Buffer, and inspect. REPL code executes inside the server process with application privileges; the localhost restriction is the security boundary, so do not expose or proxy DevConsole to untrusted networks.
The same running-process REPL is available from a terminal with tsf repl. It discovers the application started by tsf-dev or accepts --pid/--url; use tsf repl --new to build and start a separate application REPL process. See CLI Tools.
Environment
Displays application configuration from the config class. Keys containing SECRET, PASSWORD, DSN, TOKEN, or KEY are masked.
Workers
BullMQ job inspector showing queue statistics (active, waiting, delayed, completed, failed counts), live jobs, and the latest 200 in-memory entries from WorkerRecorderService.
Architecture
Transport
DevConsole uses SRPC over WebSocket (/_devconsole/ws) for bidirectional communication. The protocol is defined in resources/proto/devconsole.proto and uses Protocol Buffers for encoding.
Real-time events (new HTTP requests, SRPC messages, database queries, mutex state changes, worker jobs) are pushed from server to client without polling.
Security
Access is restricted to localhost connections only. The DevConsoleLocalhostMiddleware checks that the request originates from 127.0.0.1 or ::1 using the socket's remoteAddress (not proxy headers). SRPC authentication is bypassed for DevConsole connections.
How It Works
DevConsole is wired by DevConsoleRuntime when the app listens. Its HTTP observer belongs to that app. Database, SRPC, worker, and mutex observers are currently process-global and are not ownership-filtered, so multiple apps in one process can appear in the same console:
- HTTP Runtime —
app.http.registerObserver()captures completed request/response data and controller errors. - SRPC —
registerSrpcObserver()observes messages and connection lifecycle. - Database —
registerDatabaseQueryObserver()captures query start/finish events with timing and errors. - Worker Recorder —
registerWorkerObserver()listens to BullMQ job lifecycle events. - Mutex (
withMutex) —registerMutexObserver()tracks mutex acquisitions and releases.
Visible HTTP, SRPC, database-query, and mutex histories are stored in ring buffers (DevConsoleStore). WorkerRecorderService history remains unbounded even though the UI returns only its latest 200 records, so long-running processes should account for that separate history.
Frontend
The frontend is a Vue 3 SPA built with Vite. Source lives in devconsole/ and builds to dist/devconsole/. The built assets are served by DevConsoleController at /_devconsole/.
In development, the frontend can be run standalone with cd devconsole && npm run dev, which proxies API and WebSocket requests to localhost:3000.